Welcome to geeViz#
GeeViz is a free open source Python package developed by RedCastle Resources for exploring and analyzing Earth observation data within the Google Earth Engine (GEE) platform. geeViz provides user-friendly functions to simplify complex data processing, analysis, and visualization tasks, acting as a toolkit to make working with GEE data more accessible.
Background#
RedCastle Resources has been using Google Earth Engine since 2012 for production-oriented landscape monitoring. Until 2017, most of our GEE scripts were written in javaScript. We recognized using the Python API would be more versatile than javaScript, but there was no equivalent to the Code Editor to debug our outputs.
In 2014, RedCastle Resources began developing the Landscape Change Monitoring (LCMS) Viewer framework for the US Department of Agriculture Forest Service (FS) to visualize and deliver landscape change detection map outputs using GEE. This framework proved invaluable at communicating what LCMS was and how to interact with a large multi-temporal dataset.
- In 2019, we first published the geeViz Python package. We opened the majority of the LCMS Viewer framework to become geeViz.geeView, providing the same functionality LCMS leveraged to anyone using GEE. The data processing libraries we used were also converted from javaScript to Python and included as additional modules:
geeViz.getImagesLib module facilitates processing Landsat, Sentinel-2, MODIS, and other datasets using standardized methods that help avoid common mistakes most of us make when using GEE.
geeViz.changeDetectionLib module facilitates using GEE’s temporal segmentation algorithms.
To date, there is no other Python package that facilitates visualizing data inside GEE using both Python scripts or notebooks.
geeViz works in a regular Python script, IPython, notebooks, Colab notebooks, Colab Enterprise notebooks, and Vertex AI Workbench notebooks.
- We continue to actively maintain geeViz to facilitate our own continental-scale mapping projects such as:
geeViz serves as the primary package used in the LCMS training, jointly developed by RedCastle Resources and Google.
- geeViz provides a number of functions for working with GEE data and avoiding common GEE pitfalls, including:
- Importing and exporting data
Helps avoid null value bugs and properly sets no data values when exporting to Google Cloud Storage or Drive
- Data filtering and manipulation
Helps avoid bugs with image date filtering when creating composites that span across the new year (common when working in the tropics or Southern Hemisphere)
Helps set resampling method properly for continuous spectral bands, while preserving nearest neighbor for QA bands
- Data analysis and visualization on a map user interface
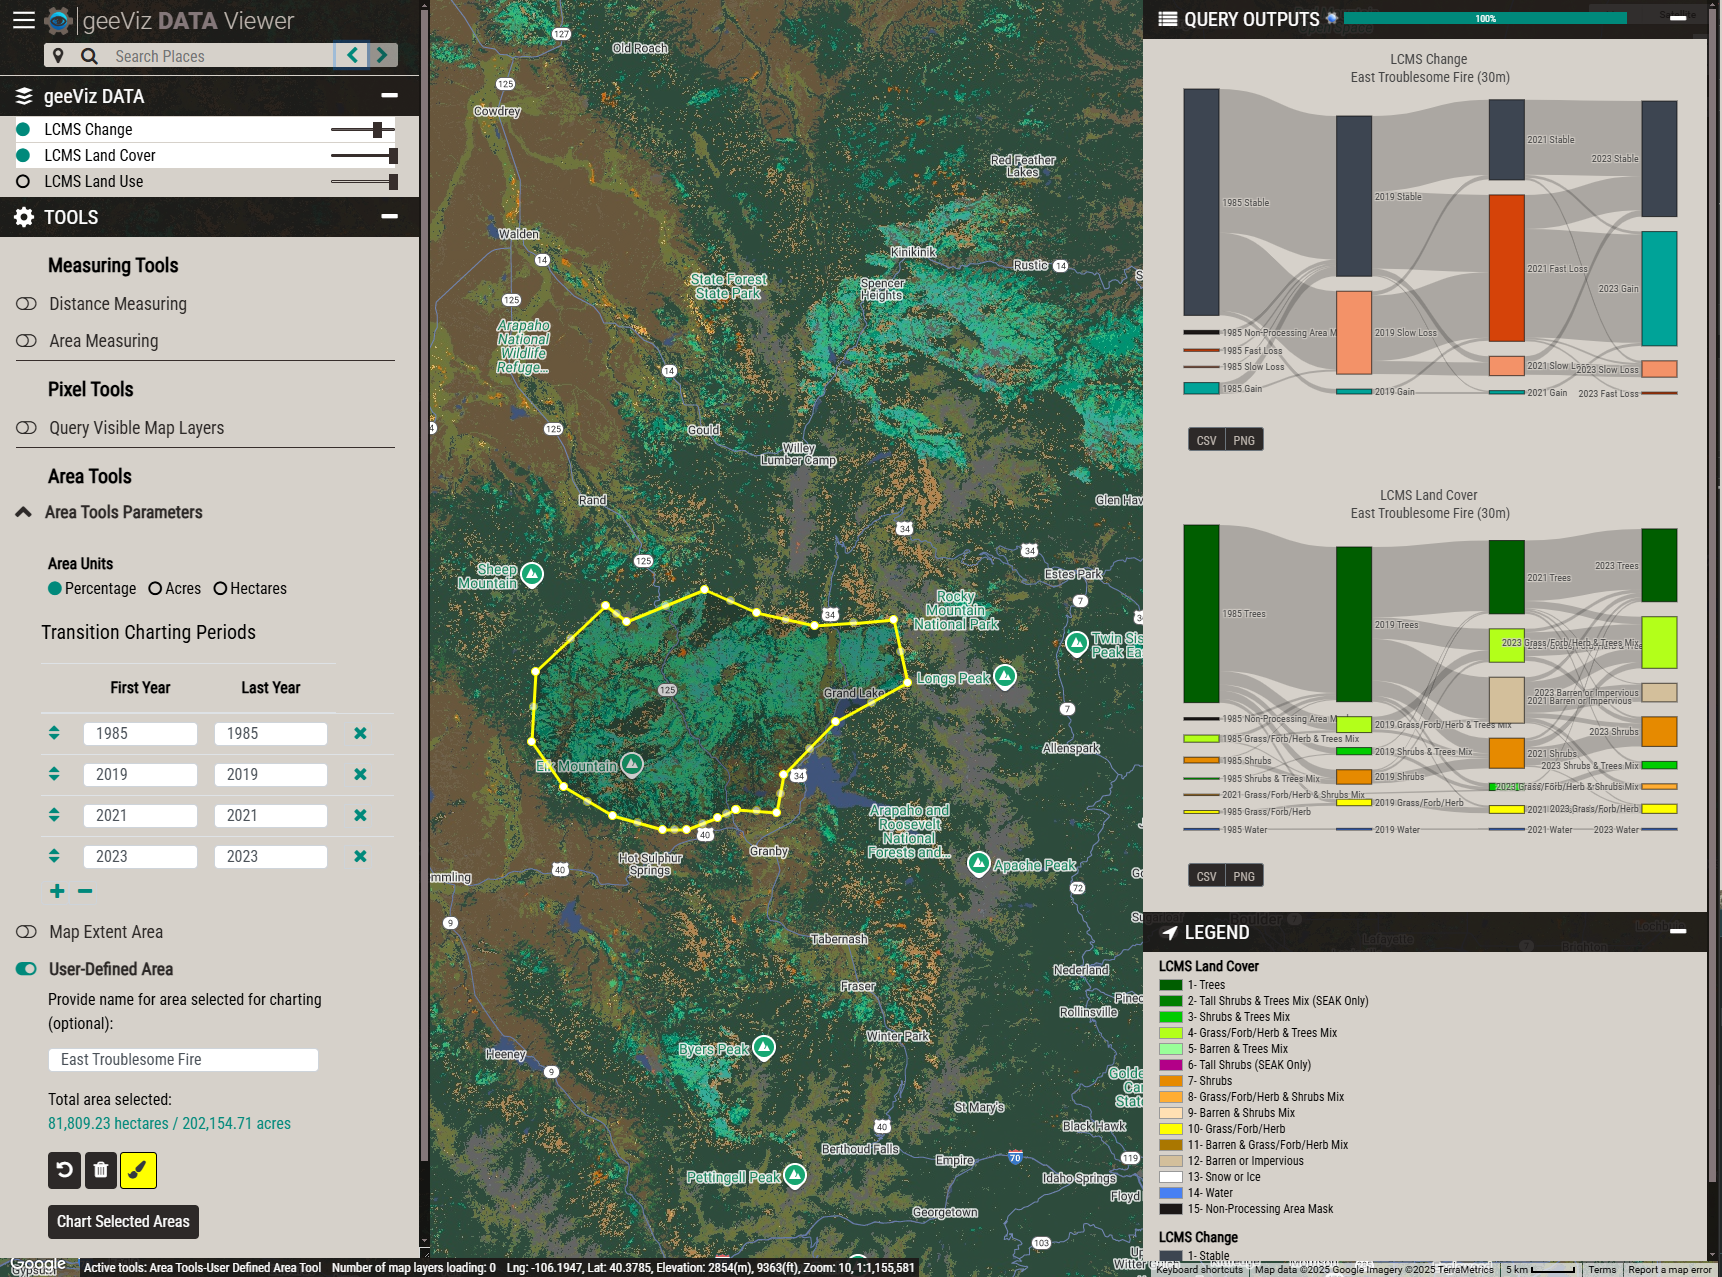
Provides an interactive map interface complete with pixel-based querying and area-based zonal stats charting
Resources#
Check out the Installation section for further information, including how to install the package.
Check out the Examples section for examples showing uses of geeViz.
geeViz.geeView.mapper
is based on the Landscape Change Monitoring System (LCMS) Viewer framework. It leverages the same code the LCMS viewer uses, providing the ability to easily view and explore GEE objects in a map environment.
Attention
Please note that this documentation website is still under development. Future releases will have more complete documentation.
Search geeViz Documentation#
geeViz Overview#
- Installation
- Overview
- Details
- geeViz.geeView
RGB_to_hex()
baseDomain()
cleanAccessToken()
color_dict_maker()
getProject()
get_poly_gradient_ct()
hex_to_rgb()
isPortActive()
is_notebook()
linear_gradient()
mapper
mapper.port
mapper.proxy_url
mapper.refreshTokenPath
mapper.serviceKeyPath
mapper.project
mapper.turnOffLayersWhenTimeLapseIsOn
mapper.addAreaChartLayer()
mapper.addLayer()
mapper.addSelectLayer()
mapper.addTimeLapse()
mapper.centerObject()
mapper.clearMap()
mapper.clearMapCommands()
mapper.clearMapLayers()
mapper.populateAreaChartLayerSelect()
mapper.setCanReorderLayers()
mapper.setCenter()
mapper.setMapTitle()
mapper.setQueryBoxColor()
mapper.setQueryCRS()
mapper.setQueryDateFormat()
mapper.setQueryPrecision()
mapper.setQueryScale()
mapper.setQueryToInfoWindow()
mapper.setQueryToSidePane()
mapper.setQueryTransform()
mapper.setTitle()
mapper.setYLabelBreakLength()
mapper.setYLabelFontSize()
mapper.setYLabelMaxLength()
mapper.setYLabelMaxLines()
mapper.setZoom()
mapper.turnOffAllLayers()
mapper.turnOnAllLayers()
mapper.turnOnAutoAreaCharting()
mapper.turnOnInspector()
mapper.turnOnSelectionAreaCharting()
mapper.turnOnUserDefinedAreaCharting()
mapper.view()
polylinear_gradient()
refreshToken()
robustInitializer()
run_local_server()
serviceAccountToken()
setProject()
verified_initialize()
- geeViz.getImagesLib
HoCalcAlgorithm2()
RefinedLee()
addDateBand()
addFullYearJulianDayBand()
addIndices()
addJulianDayBand()
addSAVIandEVI()
addSensorBand()
addSoilIndices()
addTCAngles()
addYearBand()
addYearFractionBand()
addYearJulianDayBand()
addYearYearFractionBand()
addZenithAzimuth()
applyBitMask()
applyCloudScoreAlgorithm()
cFmask()
cFmaskCloud()
cFmaskCloudShadow()
collectionToImage()
compositeDates()
compositeTimeSeries()
dailyMosaics()
defringeLandsat()
exportToAssetWrapper()
exportToCloudStorageWrapper()
exportToDriveWrapper()
fillEmptyCollections()
formatArgs()
getClimateWrapper()
getImageCollection()
getLandsat()
getModisData()
getProcessedLandsatScenes()
getProcessedModis()
getQABits()
getS1()
getS2()
getSentinel2()
getTasseledCap()
harmonizationChastain()
harmonizationRoy()
landsatCloudScore()
maskEmptyPixels()
maskS2clouds()
medoidMosaicMSD()
offsetImageDate()
rescale()
setNoData()
sieve()
simpleAddIndices()
simpleAddTCAngles()
simpleGetTasseledCap()
simpleTDOM2()
simpleWaterMask()
superSimpleGetS2()
toDB()
toNatural()
uniqueValues()
wrapDates()
- geeViz.changeDetectionLib
- geeViz.taskManagerLib
- geeViz.assetManagerLib
- geeViz.cloudStorageManagerLib
- geeViz.gee2Pandas
- geeViz.foliumView
- geeViz.phEEnoViz
- geeViz.geeView
- Examples
- Python script examples
- Python notebook examples
- Getting Started using geeViz
- Starter geeViz geeView Notebook
- Importing
geeViz.geeView
- Adding a GEE image (NLCD) to the
Map
and viewing and querying it - Visualizing multiple layers on the map
- Introducing map query lookup tables and custom styles
- Visualizing vectors and rasters on the map
- Visualizing GEE layers as a local geojson vector
- Using geeView’s
Map.addTimeLapse
function to visualize animageCollection
- Importing
- Starter geeViz geeView Notebook
- Visualize multi-temporal imageCollections
- Visualize Annual NLCD
- Visualize MapBiomas Datasets
- Visualize Dynamic World
- Visualize the Global Land Cover Dataset
- Visualize LCMS and LCMAP Outputs
- Leverage geeViz.getImagesLib to consistently process Landsat data
- Interactively summarize data
- Visualizing Area Summaries
- Basic Area Charting
- Line and Sankey Charts
- Ways of adding area charting layers
- Charting Non-Thematic Data
- Charting Images
- Charting Images Without Color and Name Properties
- Charting Time Lapses
- Charting Thematic Data without set properties
- Comparing map output versions
- Other charting summary zone selection methods
- Visualizing Area Summaries
- Learn how geeViz compares to geeMap
- Run LandTrendr
- Visualize LCMS and LCMAP Outputs
- Visualize CCDC Outputs
- Crosswalk LCMS Levels
- Getting Started using geeViz
- Other examples